Power and sample size calculator for mitochondrial DNA association studies (Shiny)
The functions detailed inside the piece of code below (in a Gist) has been useful for me when I had to calculate many possible scenarios of statistical power and sample size. The formulae were taken from the article of Samuels et al., AJHG 2006, and the script showed even useful for making a variety of comparative plots.
This is intended for estimating power/ sample size in association studies, involving mitochondrial DNA haplogroups (which are categories whose frequencies depend on each other), on a Chi-square test basis. The problem with scripts is that sometimes they aren’t as friendly to many people as GUIs are. To solve this, there are many solutions but, as I don’t have programming background (apart from R), the most straightforward for me was Shiny.
Shiny is a friendly interface which allows for great interactive features (see its Tutorial), and it loads onto the web browser from an open R console, just by clicking:
https://aurora.shinyapps.io/mtDNA_power_calc/
This Gist, displays a simple graph using two power/number-of-cases values (it was hard for me to show the graph, mostly thanks to Stackoverflow and to MadScone):
library(shiny)
shiny::runGist('5895082')
Where 5895082 is the ID of the Gist. Here is the source:
To work with files inside your computer, just run R from the same directory of the files ui.R and server.R, and execute the Gist with the command:
runApp()If this doesn’t work, you can paste the complete path to the ui and server files:
runApp("path/to/directory")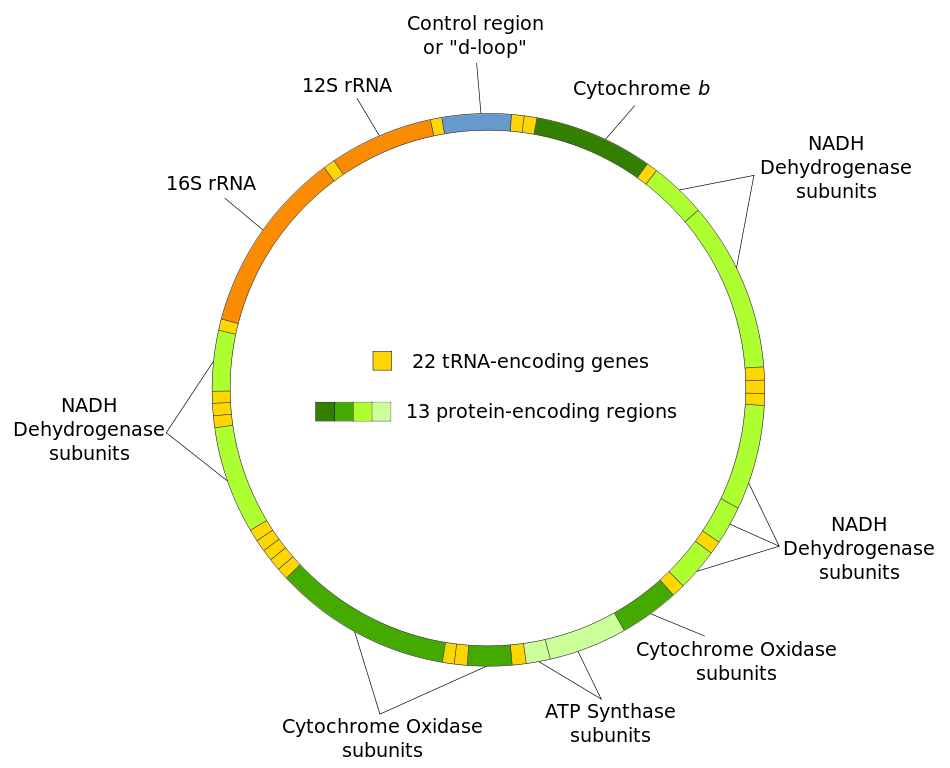
Structure of the human mitochondrial genome. Photo credit: Wikipedia
