…about R, for beginners
These days I was remembering my beginnings as a linux user few years ago, and how I found R (possibly in a very unlikely way: searching for a SPSS alternative in Linux). For two years, R had been almost impossible for me. I didn’t understand its syntax (I don’t have programming background), and luckily I had installed R Commander (Rcmdr) to perform simple analysis and plots…
Another feature of Rcmdr (that I didn’t use) was that every click to a button remains in a part of Rcmdr’s console, and then it can be copied, used and modified. Indeed, the ‘copypaste’ thing has revealed to me as the best way to acquire, recyle, modify and run commands.
Have you installed R? You can try this (nice) code:
- First we store an object called
objectin R’s memory (just like a big calculator)
object <- seq(1,100, by=5)Objectstores the sequence (seq) from 1 to 100, by 5. That is: 1, 6, 11, 16, 21 26, 31… If you type?seqin the console, you will have a brief help.With R, you can calculate big numbers, logarythms and fractions storing its components, with less chance of errors than with an ordinary calculator.
You can create new variables from old ones:
logobject <- log10(object)Logobjectstores the decimal logarythm of every value insideobject. That is:
logobject
    [1] 0.0000000 0.7781513 1.0413927 1.2041200 1.3222193 1.4149733 1.4913617
    [8] 1.5563025 1.6127839 1.6627578 1.7075702 1.7481880 1.7853298 1.8195439
[15] 1.8512583 1.8808136 1.9084850 1.9344985 1.9590414 1.9822712- You can also plot the variables with simple functions like
plot:
plot(object)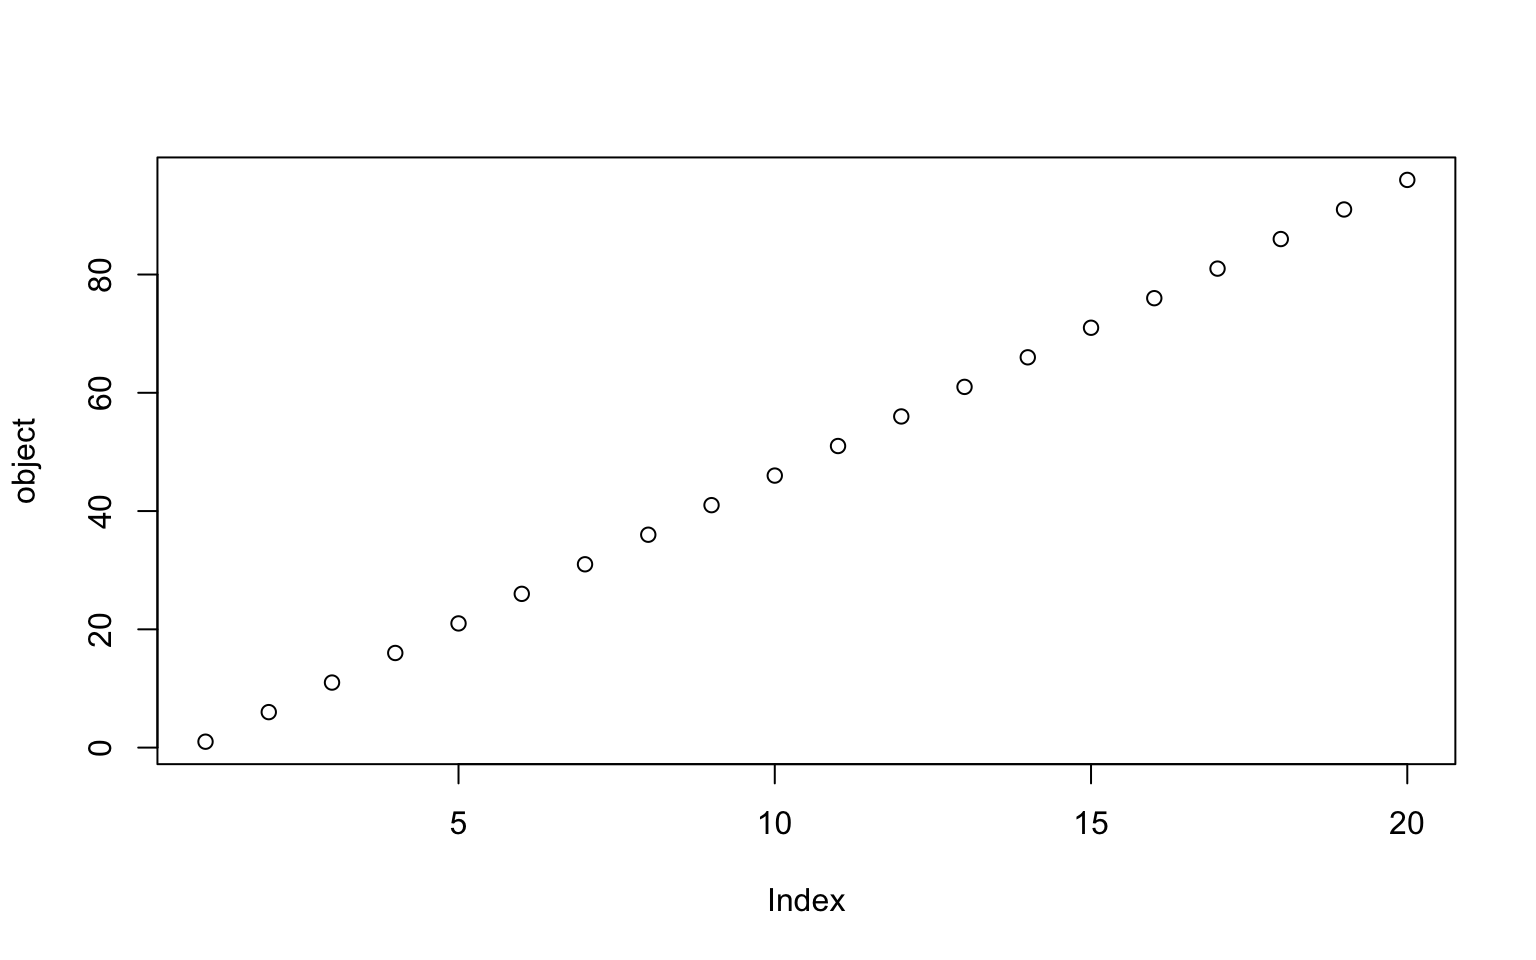
plot(object, logobject)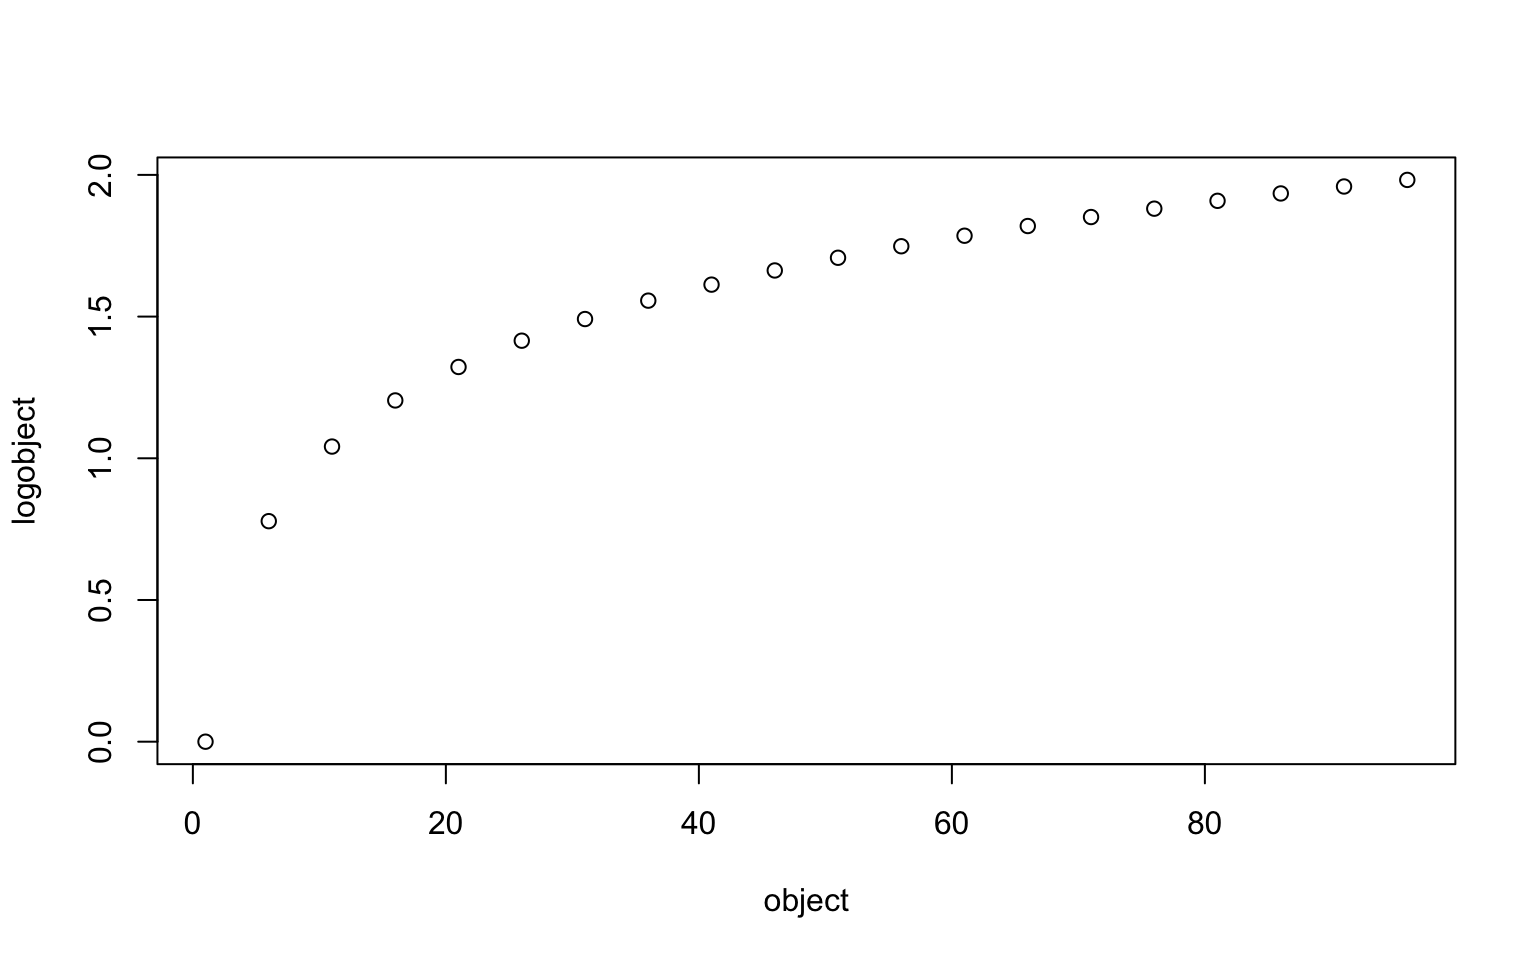
plot(object, logobject, col = "red", xlab="My X axis", ylab= "This is my Y axis", main="My first plot")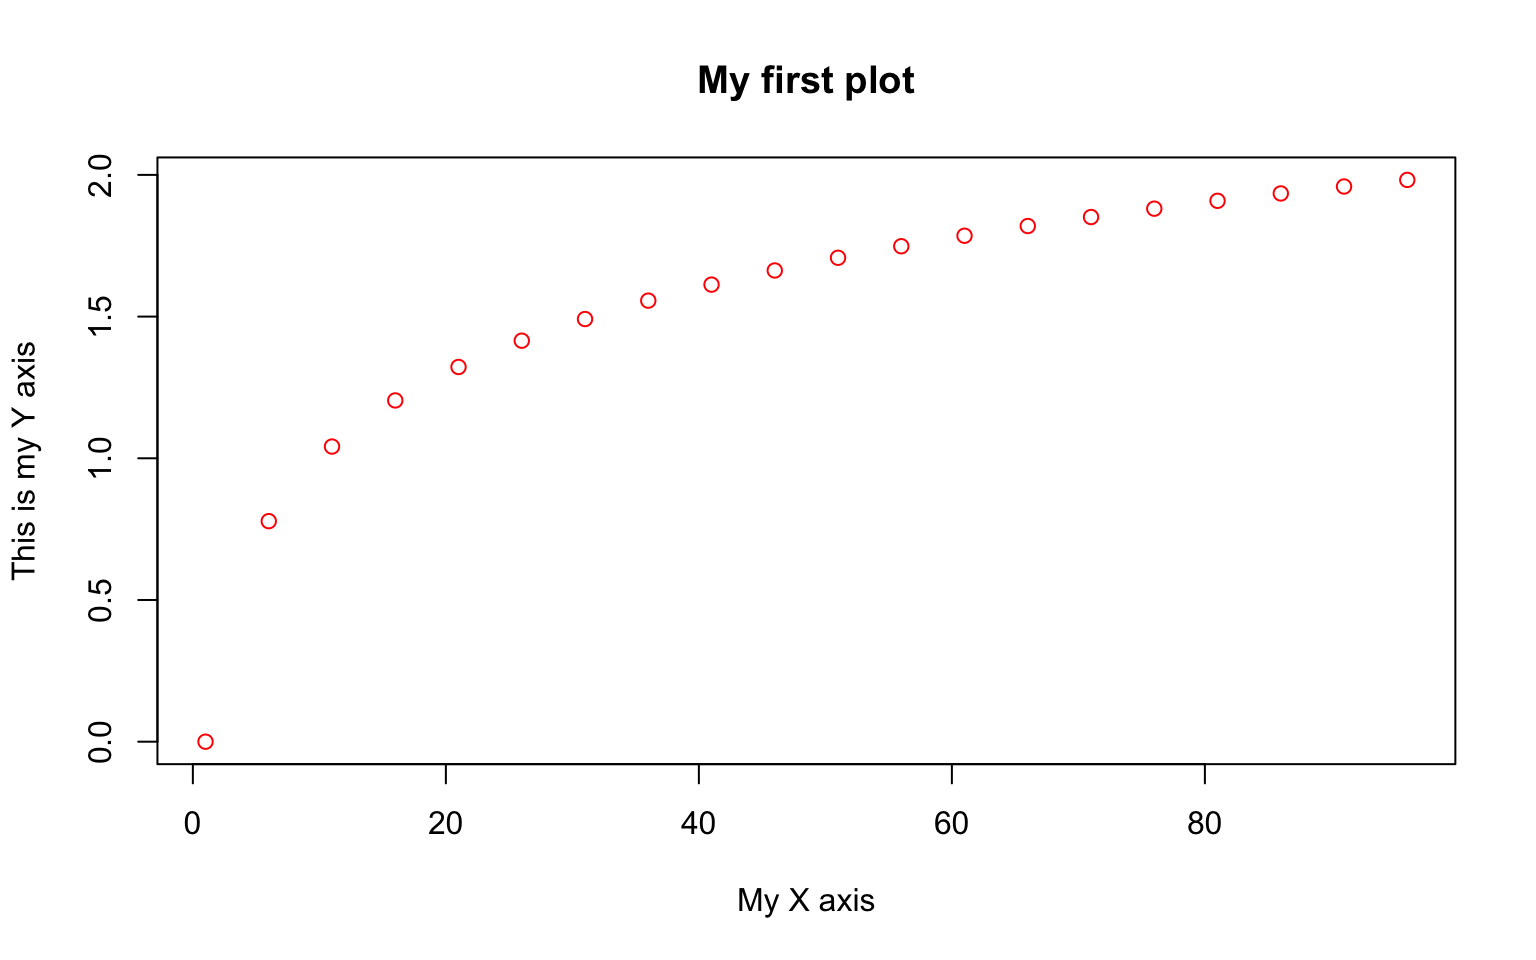
As you can see, is not very difficult to change the color “argument”, from “red” to “green” or “blue” for instance. The title, instead of “My first R plot” can be changed to “My coloured R plot”, or change the labels of the axes. Don’t forget to store these commands and new ones, in a plain Text document, Wordpad etc.. so you can recycle them and fix syntax errors!
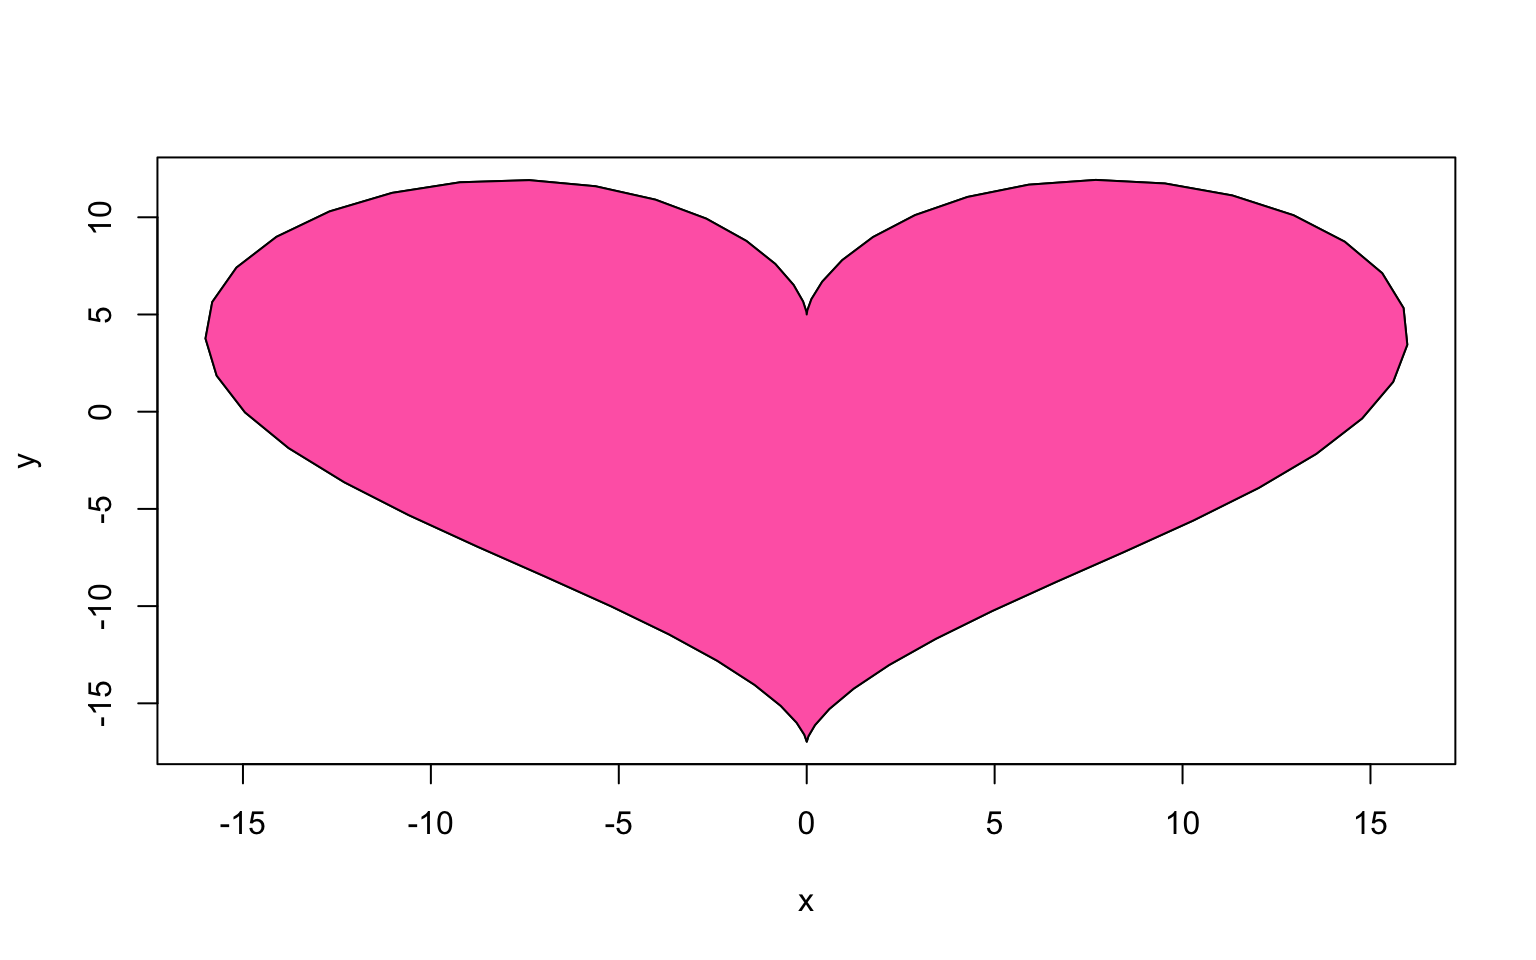
If you feel confident, you can try this. The spoiler is here, by DWin
dat <- data.frame(t=seq(0, 2*pi, by=0.1) )

xhrt <- function(t) 16*sin(t)^3

yhrt <- function(t) 13*cos(t)-5*cos(2*t)-2*cos(3*t)-cos(4*t)

dat$y = yhrt(dat$t)

dat$x = xhrt(dat$t)

with(dat, plot(x,y, type="l"))

with(dat, polygon(x,y, col="hotpink"))