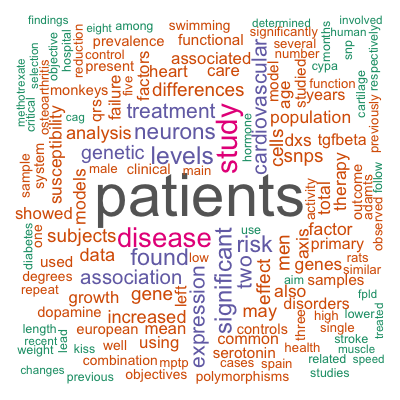
Wordclouds are one of the most visually straightforward, compelling ways of displaying text info in a graph. Of course, we have a lot of web pages (and even apps) that, given an input text, will plot you some nice tagclouds. However, when you need reproducible results, or getting done complex tasks -like combined wordclouds from several files-, a programming environment may be the best option. In R, there are (as always), several alternatives to get this done, such as tagcloud and wordcloud.

Continue reading

One of the things I most like from R + Shiny is that it enables me to serve the power and flexibility of R in small “chunks” to cover different needs, allowing people not used to R to benefit from it. However, what I like most is that’s really fun and easy to program those utilities for a person without any specific programming background. Here’s a small hack done in R/Shiny: it covered an urgent need for a study involving patient randomisation to two branches of treatment, in what is commonly known as a clinical trial.

Continue reading

My PC just passed away. My good old one since 2009… so I decided to buy a desktop computer running OSX 10.10 (although I cannot exclude the possibility of partitioning the disk and installing also Linux…). For now, I missed some apps, which I installed with Fink (a popular debian-based distro ported to Mac). One of the programs I was fiddling around with was BayesX: “Bayesian Inference in Structured Additive Regression Models”, authored by great people at Muenchen University, (specially Nadja and Thomas, whom I’m glad to know personally).

Continue reading

The R-Spain Conferences have been taking place since 2009 as an expression of the growing interest that R elicits in many fileds. The organisers are the Comunidad R Hispano (R-es). The community supports many groups and initiatives aimed to develop R knowledge and widen its use. To attend the talks by streaming (they are in Spanish) you must registrate. There is also a scientific programme with the presentations (some in English) here.

Continue reading

Playing with my tablet some time ago, I wondered if installing R could be possible. You know, a small android device “to the power of R”… After searching on Google from time to time, I came across some interesting possibilities: R Instructor, created “to bridge the gap between authoritative (but expensive) reference textbooks and free but often technical and difficult to understand help files”. R Console Free. provides the necessary C, C++ and Fortran compilers to build and install R packages.

Continue reading

...start using R, from scratch!

Some time ago, since I was able to use R by myself, have found some fellows and other people who wanted to learn R as well. Then I pointed them to help pages, to CRAN repositories… but in some cases they said that didn’t know how to start using those resources. Obviously, the main self-perceived limitation for non-programmers is the use of “commands” -ok, many of the 80’s kids will remember the use of some command lines to access games such as PacMan, Frogger… 🙂

Continue reading

The functions detailed inside the piece of code below (in a Gist) has been useful for me when I had to calculate many possible scenarios of statistical power and sample size. The formulae were taken from the article of Samuels et al., AJHG 2006, and the script showed even useful for making a variety of comparative plots. This is intended for estimating power/ sample size in association studies, involving mitochondrial DNA haplogroups (which are categories whose frequencies depend on each other), on a Chi-square test basis.

Continue reading

Author's picture

aurora-mareviv

Anesthesiologist, MD, postdoc. Utter Rstats geek

Universidade de Santiago de Compostela

Spain