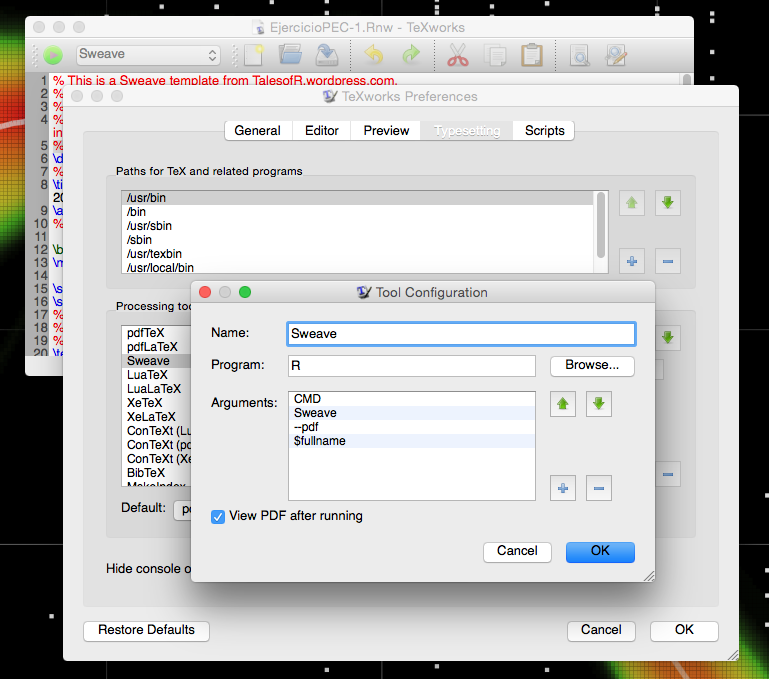
I am about to go on a short holiday, so I was tidying the code lines I had scattered around before leaving… And I found this: a minimal EPS to PDF converter, which is barely a LaTeX template. It is intended for transforming an .EPS graph to the .PDF format. You can copy & paste this whole code into a blank text file (but with .TEX extension) and run it with a TeX editor.

Continue reading

In the last days I was thinking about about how researchers could collaborate efficiently with their experts in statistics. With the increasing complexity in science, interchanging information can be crucial to get the best results. But what happens when a researcher doesn’t give all the information a statistician needs?. When someone asks for help in statistics -as a clinician, I need it often-, many biostatisticians ensure that some basic points are met in a research study -prior to their analysis-, and I think they should ask for them as soon as possible:

Continue reading

I use both GNU-Linux and Windows systems on a regular basis… so I’m aware of the advantages (more for GNU-Linux in my case) and disadvantages of both. Recently I needed to analyse a database from a remote location, an Excel (`*xlsx) file. The problem was that I couldn’t put my gdata library to work… some weird errors about a missing Perl interpreter… just needed to install one. Based on this tutorial in CRAN, I downloaded ActivePerl.

Continue reading

I like heatplots with p-values -or frequencies, or whatever-. Not very conclusive, but pretty anyway. And when talking about graphs, pretty will make our neurons to fire in more interesting ways: neurons like “pretty” graphs. Moreover, observing your data can be as important as analysing it. It’s better to observe, to listen your patients than making tests without knowing very much about them… In the heatmaps of the previous post, not a lot of information can be included.

Continue reading

Some months ago, I had to explore a vast amount of categorical variables before making some multivariate analyses. One good way to know your raw data, to make new hypotheses…etc, is to calculate some pairwise “crude” chi-square tests of independence of your factors, but it can be very time-consuming. I mean, not time-consuming to make the tests (with a simple command it can be done), but to revise all of them.

Continue reading

“LaTeX is a high-quality typesetting system; it includes features designed for the production of technical and scientific documentation, and is the de facto standard for the communication and publication of scientific documents.” It is also… Free and Open. Specially designed for beautiful documents even when they include special language: mathematic formulae, phonetic symbols, musical notation… The mix of normal text with special languages is indeed much better arranged in LaTeX than in any other text editor, so maybe it can be interesting for you!

Continue reading

INTRODUCTION CONFIGURING SWEAVE FOR TEXWORKS In MS Windows In (K)Ubuntu & MacOSX WRITING A .RNW FILE EDIT FOR TEXWORKS IN UBUNTU FURTHER READINGS INTRODUCTION Sweave is nothing more, nothing less than one of the best ways R can connect with a text editor, in this case LaTeX. So you don’t know anyting about LaTeX? neither did I 8 months ago… The hyperlinks in this post will take you to some great pages, to learn different things in an organised way.

Continue reading

Author's picture

aurora-mareviv

Anesthesiologist, MD, postdoc. Utter Rstats geek

Universidade de Santiago de Compostela

Spain